
Water Utility Service Area Boundaries
Is Your Water Safe? Pioneering Data Efforts Help Us Know
Thanks to new data and tools from the EPA, we no longer have to wonder who supplies our water – and whether it’s safe to drink. Read more about our collaborative provisional map that catalyzed this broader federal work, the justice metrics that were created alongside it, and how your state can get involved.
EPA’s Milestone Dataset
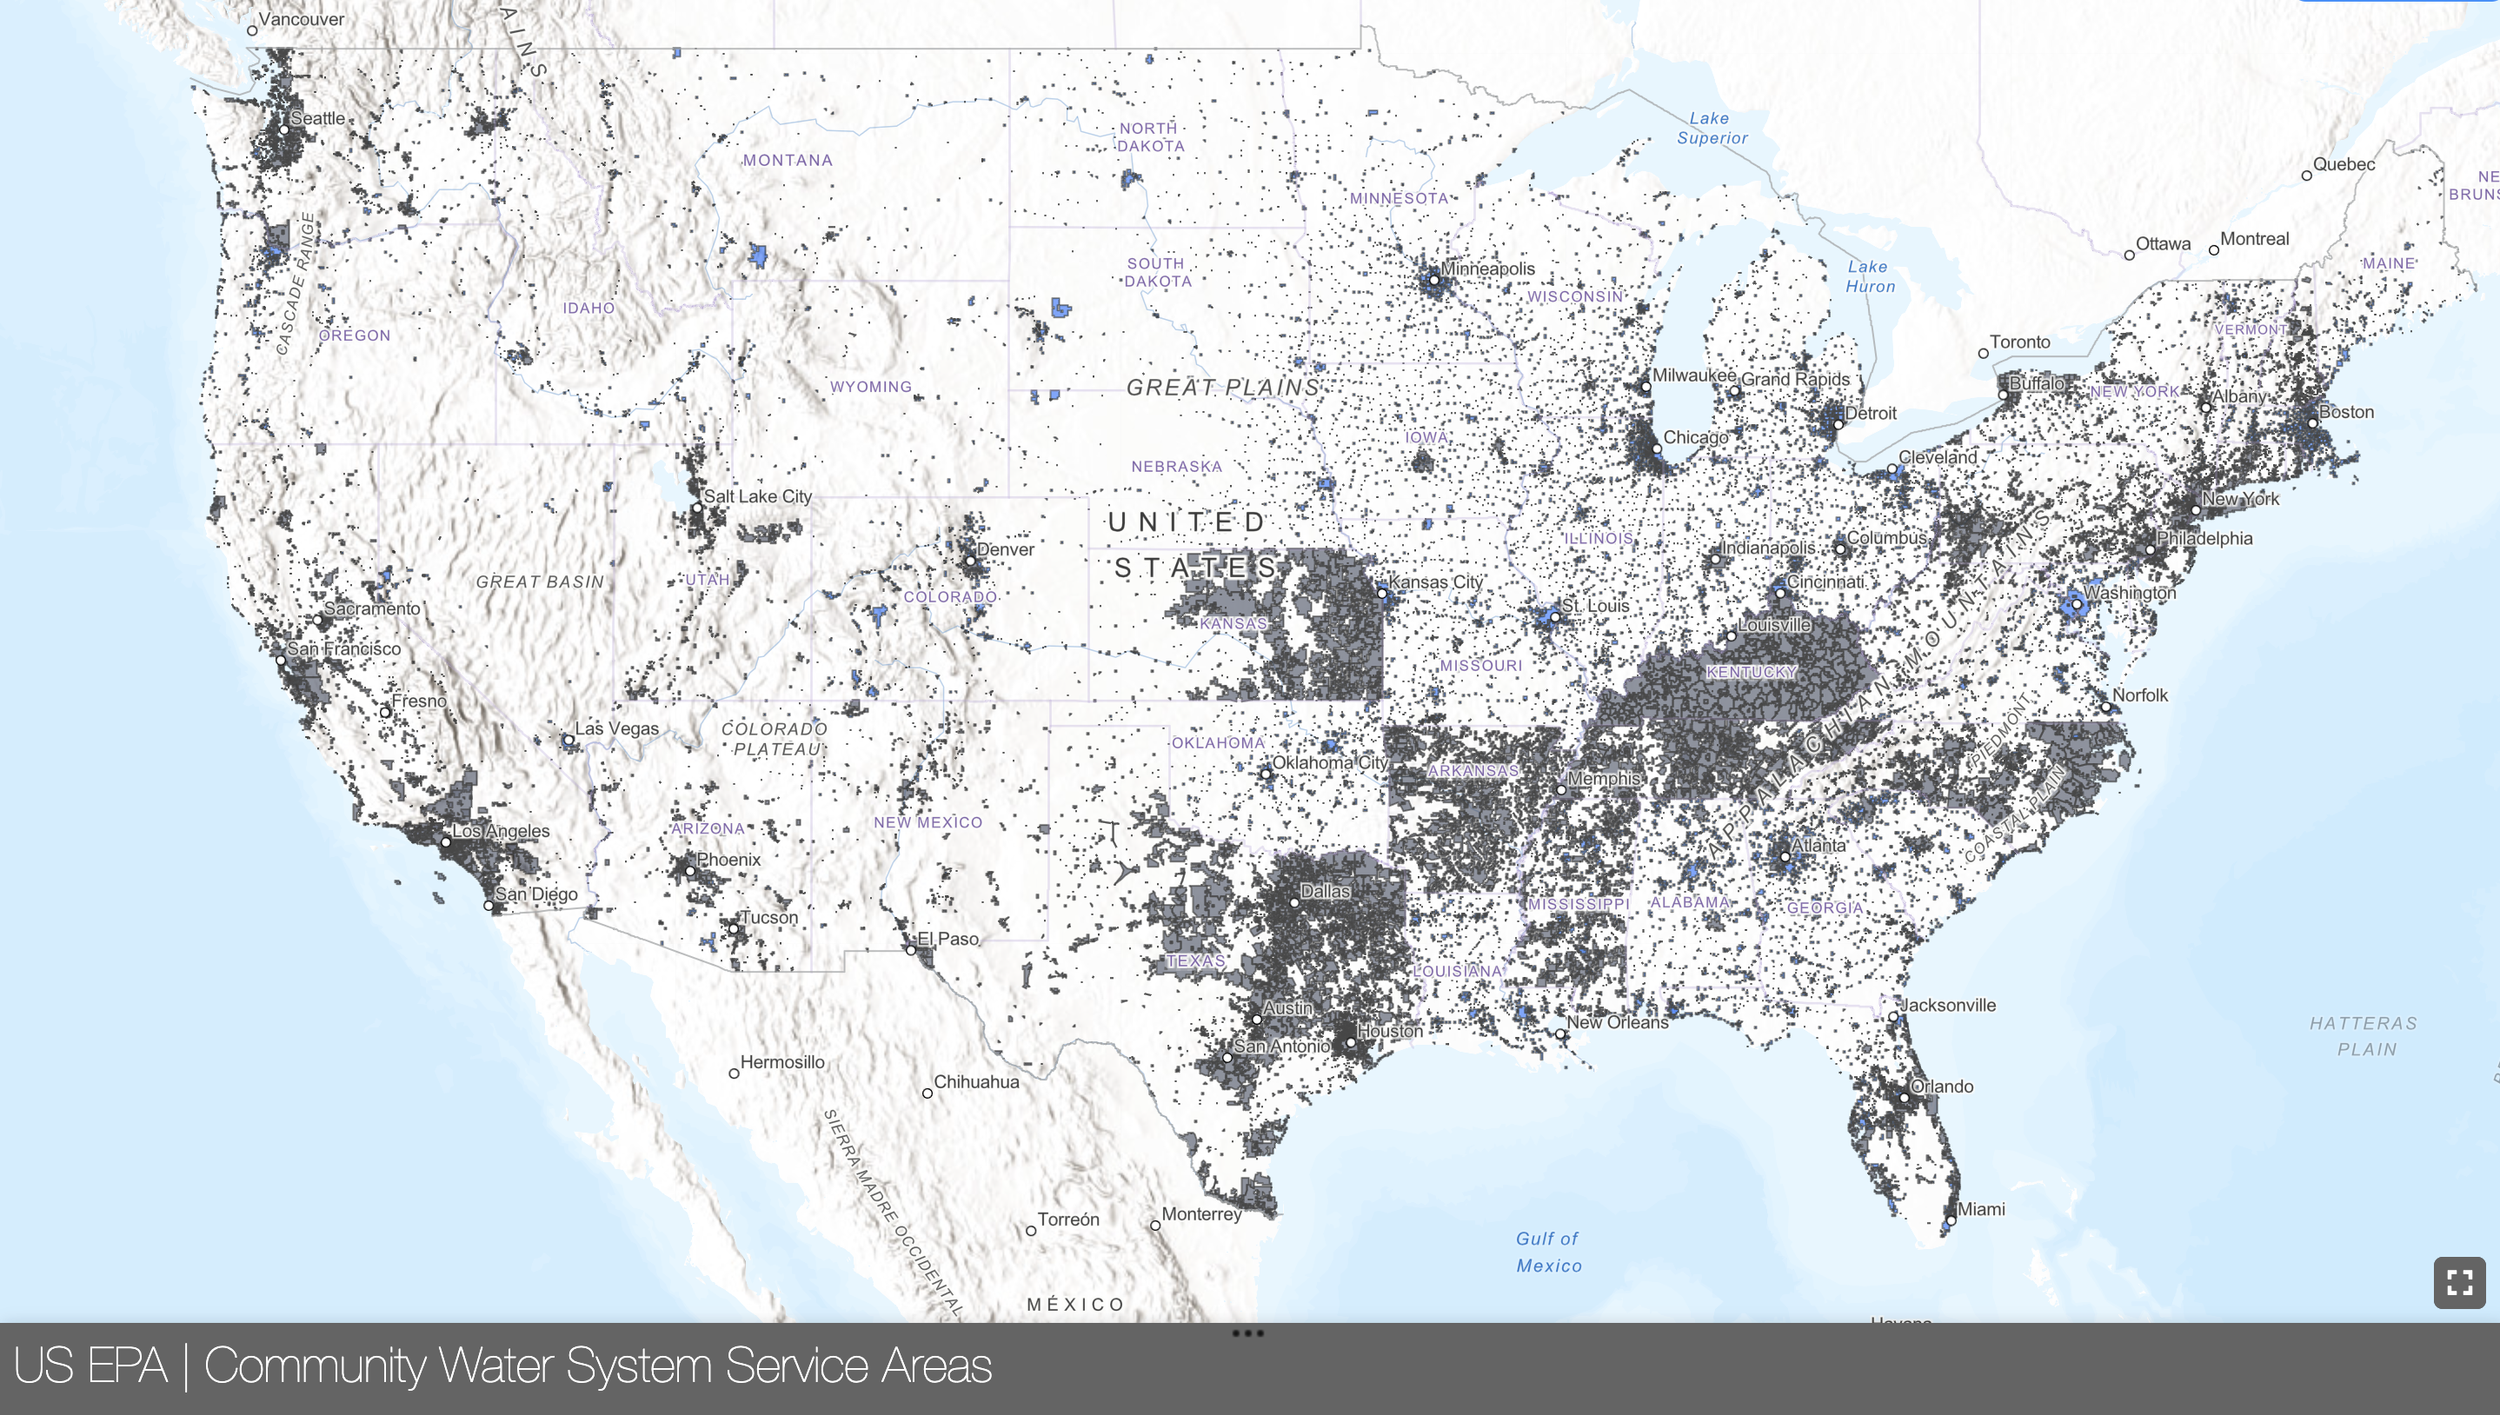
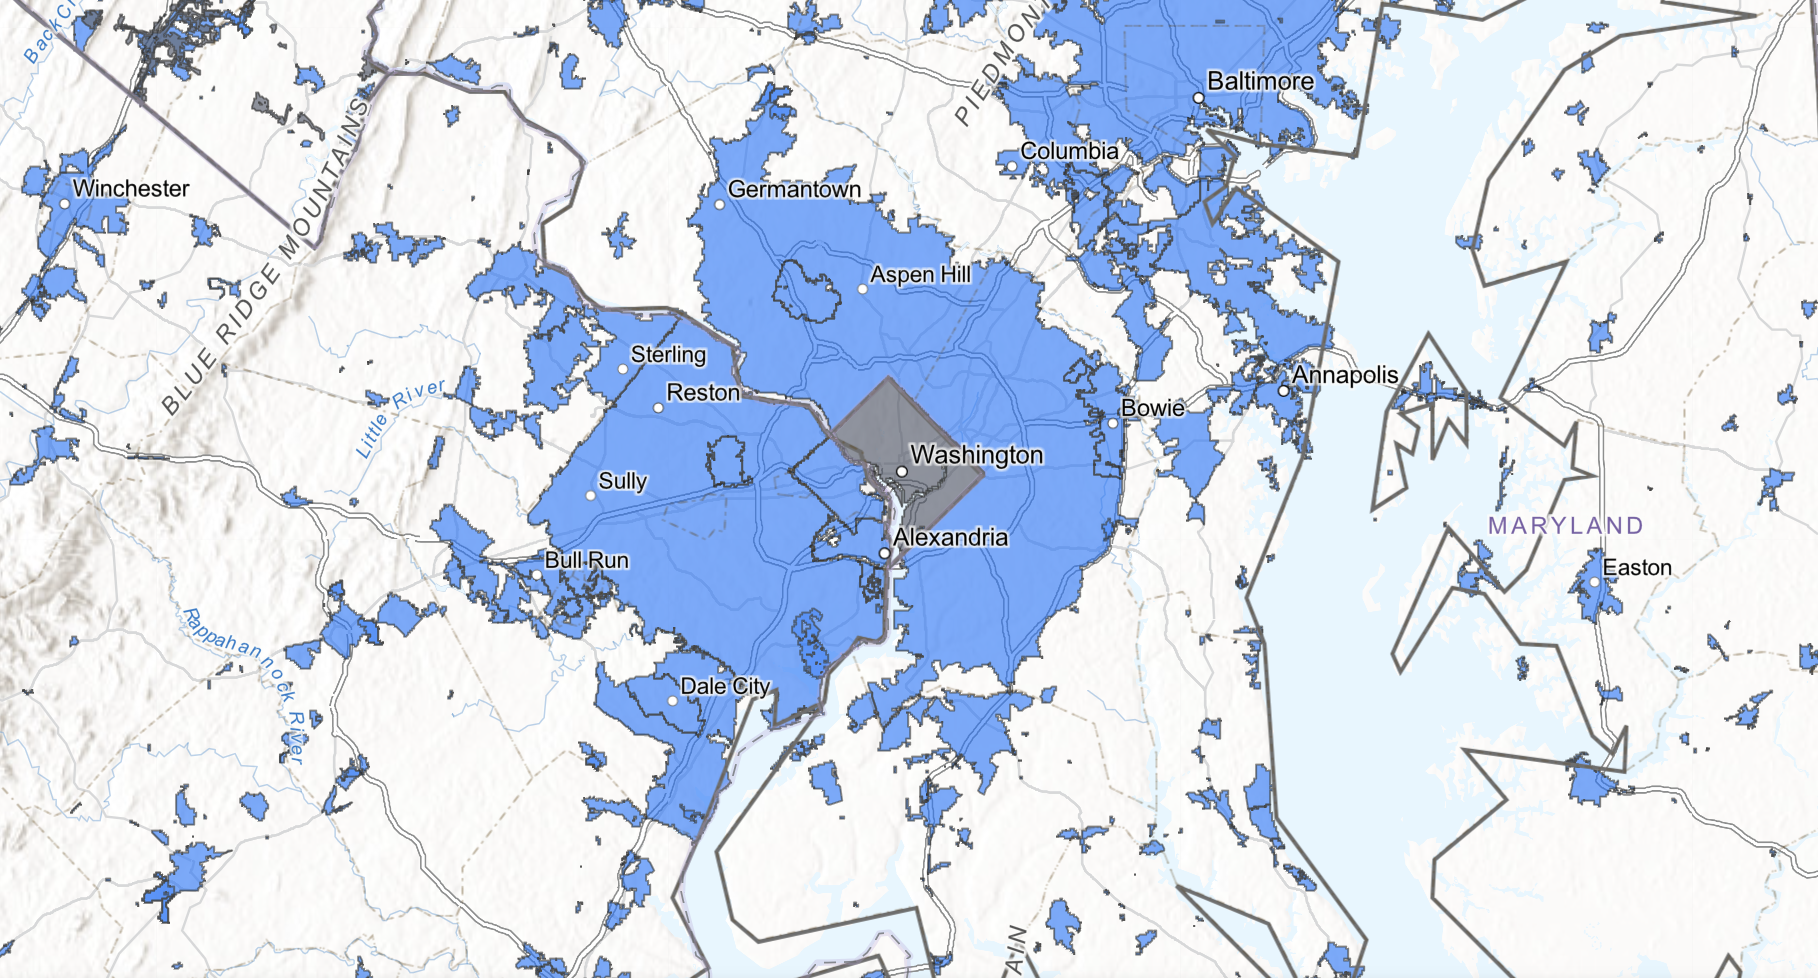
Working with SimpleLab and the Internet of Water Coalition, we engaged over 120 academic, nonprofit, industry, and government partners to prototype the first national dataset of drinking water service area boundaries (SABs). Building on our work, EPA launched an expanded effort at the federal level. In July 2024, it released the nation’s first comprehensive map of water system service area boundaries – and the first drinking water justice metric in EJScreen.
Using AI to Improve Drinking Water Data
EPA’s new dataset is comprised of both state-supplied and modeled service area boundaries. Approximately 40% of those data were sourced from states and municipalities, with the remaining systems—the 60% with no state-supplied boundaries—modeled using machine learning. Since geographic areas can be served by multiple types of water systems not included in EPA’s dataset (e.g., private wells or non-community water systems), this map should be used as a first step in learning more about the water systems most of interest to you.
Get Involved.
Federal, state, and local partners all have a part to play in improving the accuracy and utility of this milestone dataset—and we invite you to explore what your role in that process might be.
Make Technical Contributions.
Updates to EPA’s data and mapping tool will benefit from robust user feedback from technical partners and advocates interested in the creation, use, and refinement of this data. Do you have feedback or questions for the EPA?

Help improve the data.
Whether you’re a public or private utility, state regulator, or community advocate, there’s a role for you in increasing this data’s coverage and quality. If your state doesn't currently have service area boundary data, check out our playbook to learn how to create that data and replace approximations.

We work with state and federal agencies and a coalition of NGO partners to develop policy solutions for better drinking water data integration, use cases, and upkeep. Do you have ideas to contribute?