

A Data Funnel for Drinking Water Infrastructure
As of writing, the US EPA is almost halfway through allocating the nearly $31 billion made available through the Bipartisan Infrastructure Law (BIL) to Drinking Water State Revolving Funds (DWSRF). These funds represent a transformative investment, with billions of dollars allotted to improve drinking water infrastructure. The funds will replace lead pipes, address emerging contaminants like PFAS, and restore aging systems nationwide. These projects are crucial investments into our communities, providing safe drinking water for present and future generations.
But right now, we’re struggling to track these projects throughout the funding process. Often, it is prohibitively challenging to follow projects from their initial applications to the final list of signed agreements. As a result, we lose out on identifying where communities are being overlooked or success stories could be replicated across the country.
In the private sector, companies track customers through sales funnels to understand how their marketing and communications efforts are transforming potential buyers into satisfied customers. This funnel identifies which folks move through the process or stop short along the way. It answers questions about what’s working, what could be improved, and how people are interacting with the process.
We need the same thing for tracking projects and investments in drinking water infrastructure. We should be able to know how applicants successfully get funding, who's getting delayed along the way, and what projects are falling through the cracks entirely. But right now, the funnel that would show us these trends isn’t working.
The good news is that a potential solution only requires one additional piece of information—a unique ID for each project—and some states already use them. Where available, being able to simply connect projects throughout the process could transform our ability to more equitably and effectively expand access to clean drinking water. But that isn’t possible in most states yet.
Before we dive in, it’s worth highlighting that as my colleagues recently detailed in their illustrative SRF explainer, the State Revolving Fund (SRF) process includes 19 different steps that take place across federal, state, and local levels, often across multiple years. This blog is less focused on the totality of the process and refers specifically to major milestones where we can glean crucial project information.

Stage One: Applying for Funds
The top of the funnel is the SRF application process and the question, “Who’s applying for funds?” The applications are not publicly available, but most states append a Project Priority List (PPL) to their Intended Use Plan (IUP) that ranks all applicant projects based on a unique scoring criteria.
This stage illustrates which communities may or may not be applying in the first place and why. Is it a lack of technical capacity or staff resources? Undesirable terms of the SRF loan rates or likelihood of qualifying for grants? Missing or not knowing about deadlines in the application process? Addressing these questions and connecting communities with technical assistance is some of the important work tackled by EPIC’s Funding Navigator team.
Stage Two: Project Prioritization & Expected Funding
The middle portion focuses on which projects the state plans to offer funds in the given year. In most IUPs, the state includes funding decisions on the PPL, indicating the amount and terms of the loan each project is expected to receive. Other states provide a funding list, separate from the more comprehensive PPL. In this piece of the funnel, we ask, “Who is expected to receive funding?”
The answers can vary dramatically across states. Texas, for instance, doesn’t list what projects they intend to fund, but rather, which projects are being initially invited to apply for funding. States like Michigan simply denote the highest ranking projects as funded until the cumulative requested amount exceeds the annual allocation. Others like Connecticut hand-pick projects across the PPL based on scoring and other criteria.
Then, even after funding decisions have been indicated, applicants must meet various “readiness to proceed” criteria finalizing funding agreements. In some states, these hurdles must be cleared before projects get onto the funding list. Elsewhere, many of these steps still remain to be completed after reaching the funding list. For applicants lacking the technical capacity or resources to complete these steps within specified timeframes, their projects will be bypassed by another project lower on the PPL.
These differences make it challenging to determine when and why various projects fall out of the funding pipeline, but that’s why the last piece of the funnel is so crucial.
Stage Three: Finalized Agreements
The last stage is communities or utilities signing agreements so work can get underway, finally answering the question, “Where are funds going?”
This data has recently been made available through the EPA’s SRF Portal and provides, for the first time, project-level data about which projects agreed to loan or grant terms. This data lets us see how final agreements are distributed nationally and within states.
Unlike in other stages, here we at least have certainty about the final outcome—these projects received funding. The challenge, then, is connecting these agreements with projects as they appear in earlier documents. Lots can change between projects being listed on a PPL and assistance agreements being finalized.
We recently sat down to manually connect finalized agreements released by the EPA with projects listed in states’ IUPs. Our ability to do so successfully varied.
Here’s an example. In the EPA data, there are two agreements for the City of Dallas. The city also appears four times in Texas’ DWSRF IUPs over the last few years. Both agreements note project costs of $44 million, but those don’t line up with any of the IUP projects. Two project descriptions are similar, but they are from the 2023 IUP, while the agreements were signed in 2021 and 2022, so it can’t be those. Even the population figures don’t line up. One has to go back to 2017 to find a project description that matches. But even here, the project costs are different — $220 million in the 2017 IUP and a total of $88 million for the two agreements. Only by adding the values for both agreements in another column, Project Total Needs, does one get the expected $220 million and can be confident in matching this 2017 project to agreements signed years later.
Sometimes the process is complicated by states and the EPA operating on different fiscal years. Other times their project descriptions are similar, but often differ enough to create uncertainty. In some cases, agreements don’t seem to connect to IUP projects at all. This process is further complicated by congressional earmarks, which sidestep the entire SRF ranking and application process, along with having other negative impacts on the SRF program.
Fixing the Funding Data Funnel
So while each part of the funnel comes with its own challenges, the biggest problem is these stages aren’t connected.
Here’s where our unique ID comes in. One that follows each application through submission, prioritization, and financing. And implementing this wouldn’t be hard — states are already required to have a State Tracking Number when submitting final agreements to the EPA. Using this format throughout the funding process would help develop a leak-proof funnel.
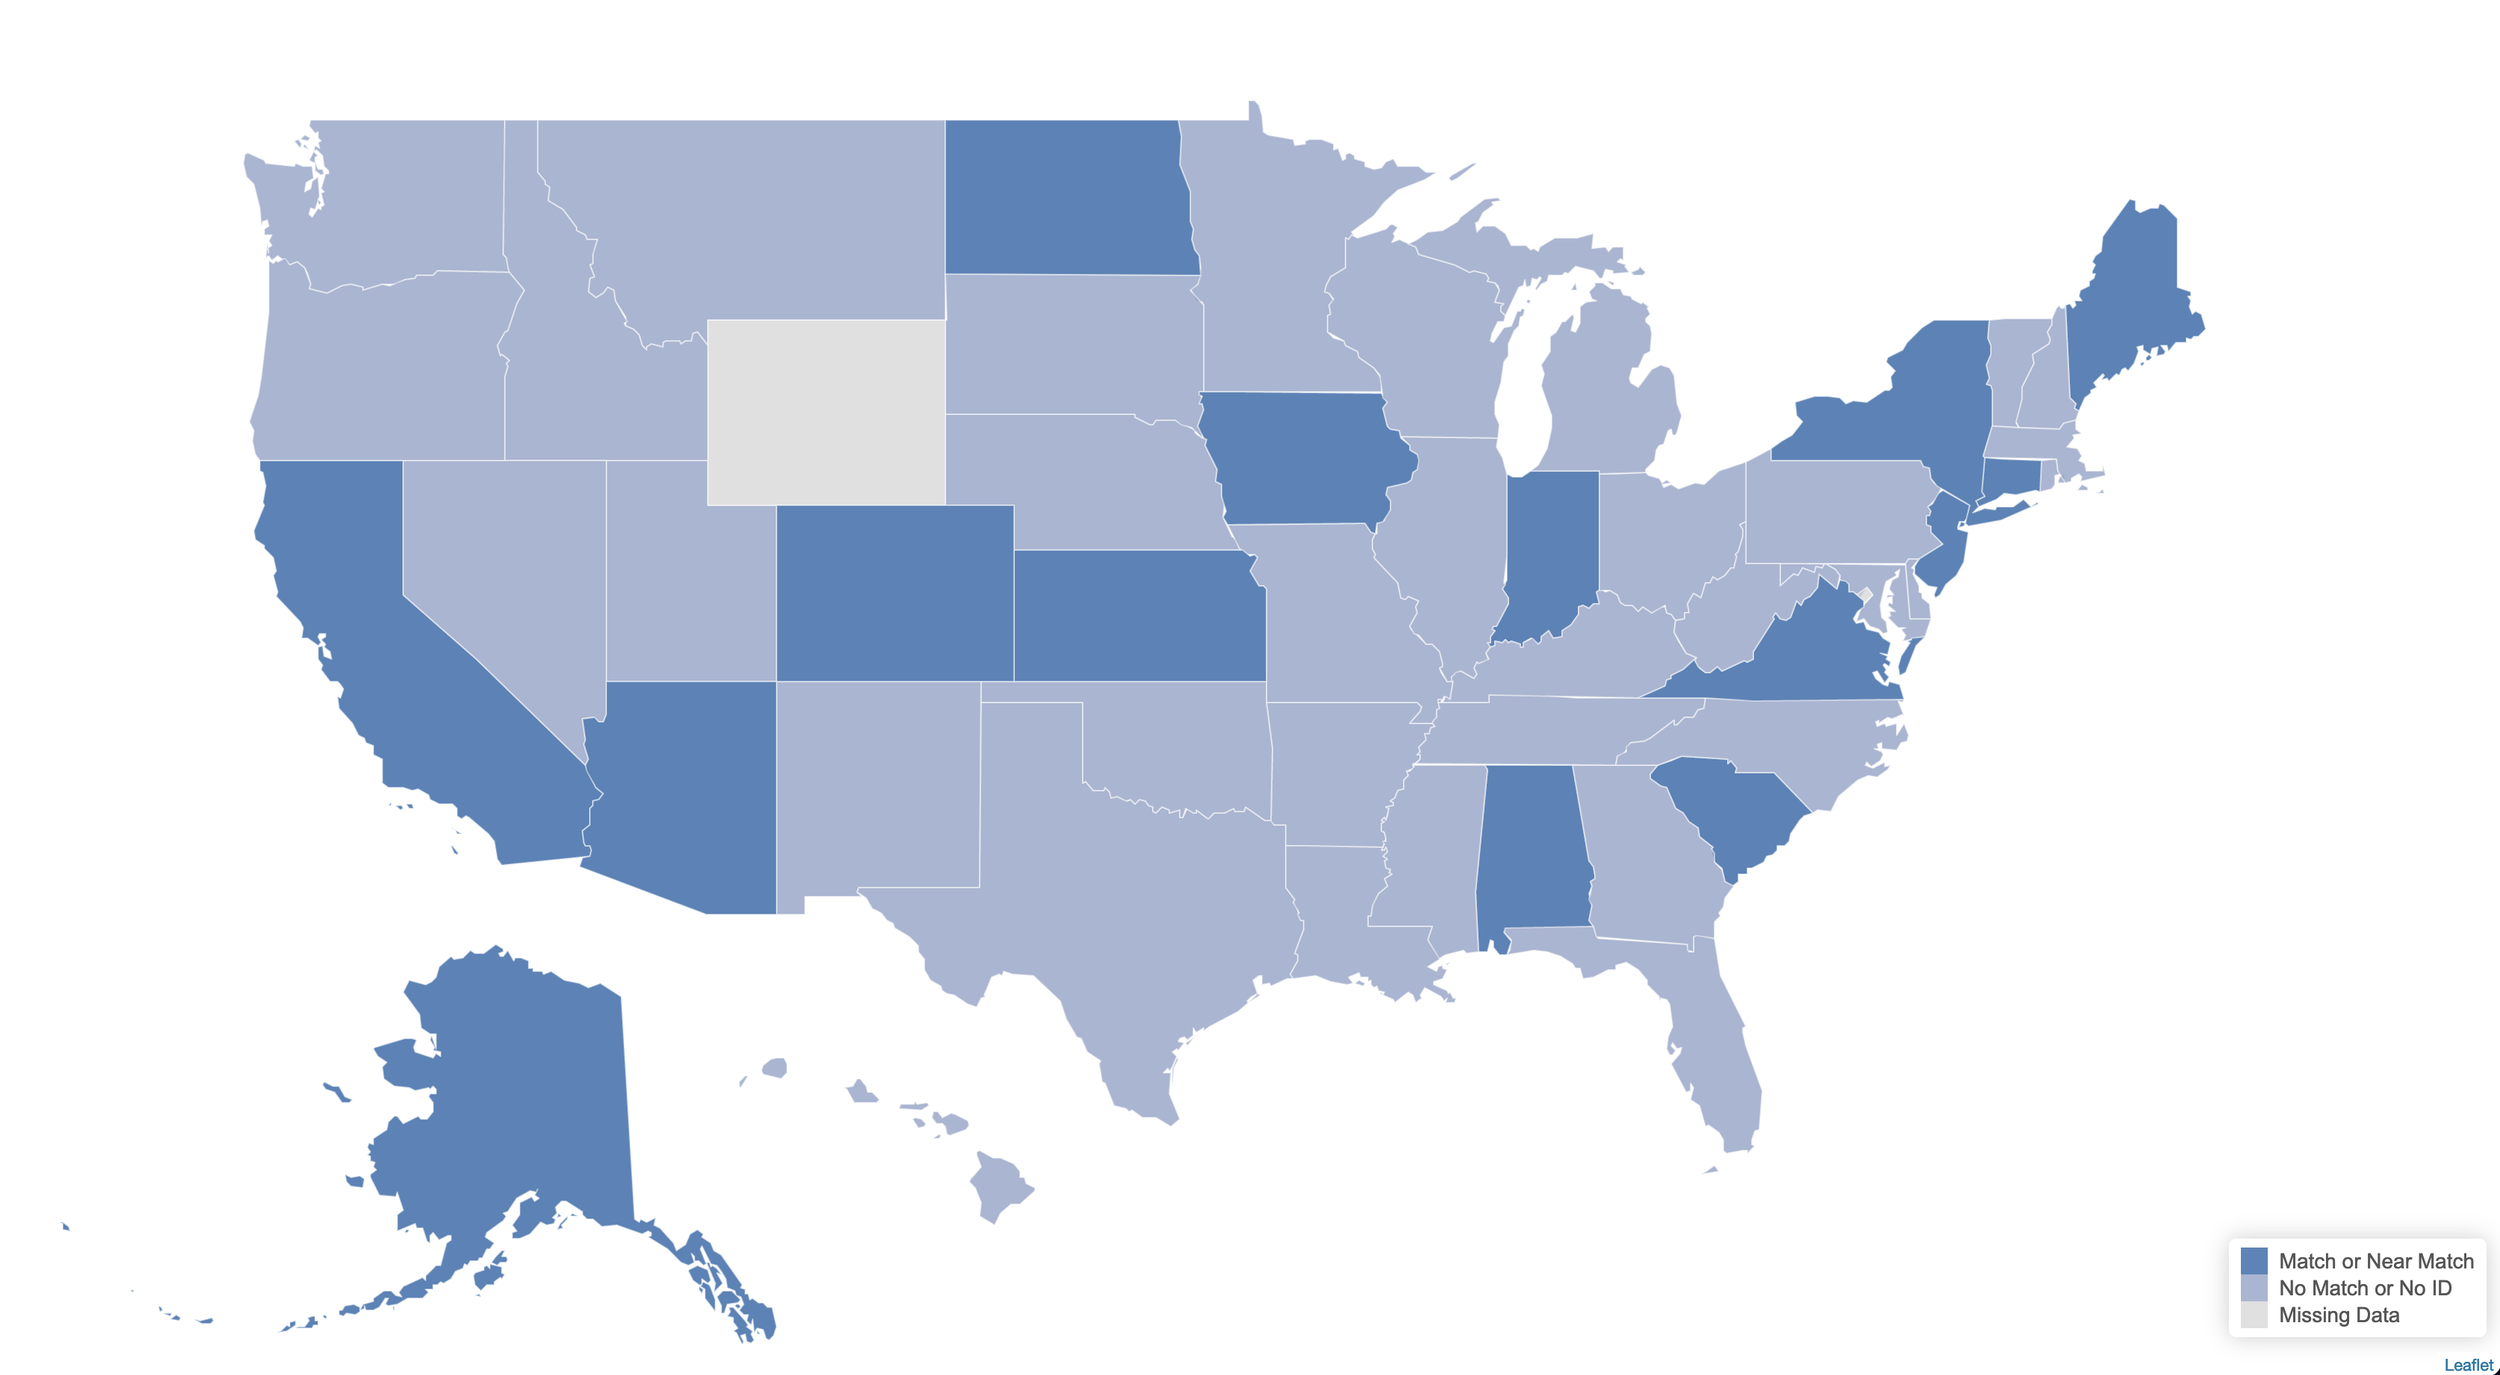
In fact, eleven states already have unique IDs in their IUPs which match up directly with IDs included in the EPA’s agreement data. Another three states use unique identifiers that are not exactly the same, but are near matches that can be connected with relative ease. Six states use unique identifiers in both their IUPs and the EPA Portal data, but they don’t match up. The remaining thirty states don’t seem to have a unique ID in their IUPs, so it is still a complicated, manual process.
A unique ID would seamlessly connect project data throughout the funnel. From there, we could connect additional data like health-based violations from the Safe Drinking Water Information System (SDWIS) or community socioeconomic data, as we did in our collaborations with Policylink. This combined data would help us answer crucial questions about who is benefiting from investments across the country and whether funding is going where it is most needed.
Without a unique ID to help associate project applications, project priority lists, funding lists, and final agreements, we can’t understand what’s working or needs improvement throughout the SRF process. Without it, we can’t effectively address issues of capacity nor environmental justice when it comes to access to safe drinking water.
Without it, we’re working with a broken funnel.