

Exploring How States are Distributing Historic Drinking Water Investments
With the recent update to the EPA’s State Revolving Fund Public Portal, we have our first chance to dig into how states utilized the first year of Bipartisan Infrastructure Law (BIL) funding for drinking water system investment. While states’ funding lists can give us clues about how states intend to fund projects, these finalized agreements confirm how loans and grants were dispersed.
In this overview, we’ll briefly explore how states are distributing these historic funds.
National Trends
Within the EPA Portal, there are 2,548 finalized agreements signed in State Fiscal Year (SFY) 2023. Of those, 10% include funds appropriated from the Bipartisan Infrastructure Law.
| Supplemental Appropriation | Agreements | Total Agreement Amount | Total Additional Subsidy Amount |
|---|---|---|---|
| 2022 BIL General Supplemental | 161 | $695m | $174m (25%) |
| 2022 BIL Lead Service Line Replacement | 97 | $227m | $109m (48%) |
| 2022 BIL Emerging Contaminants | 23 | $140m | $44m (31%) |
| 2023 BIL General Supplemental | 10 | $11.8m | $7.5m (64%) |
Of almost 300 agreements including SFY23 BIL funding, more than half utilize the 2022 General Supplemental funds. The $695 million totaled in these finalized agreements is 40% of the $1.7 billion allocated to states, territories, and tribes for the year. Ten other projects already account for the second year of BIL funding as well.
Nearly 100 finalized agreements utilize appropriations for replacing lead service lines. As explored below, these projects are not equally distributed across the country nor necessarily in states facing the highest lead burden. Almost half of the initial agreement amounts are additional subsidies, which is expected based on BIL’s requirements, but still encouraging to see working as intended. The total agreement amount of $227 million, however, only accounts for 10% of the nearly $2.8 billion appropriated in 2022 for replacing toxic lead nationwide.
Only twenty-three projects currently utilize emerging contaminant appropriations. One third of these agreements’ total value consists of additional subsidies. Because all BIL emerging contaminant funds are required to be provided as additional subsidies, this trend suggests that many of these projects are being further financed by additional SRF dollars or other sources. Similar to lead appropriations, the $140 million represents only 18% of the EPA’s funds set aside for emerging contaminant projects that year.
So, where are these funds going?
State Trends
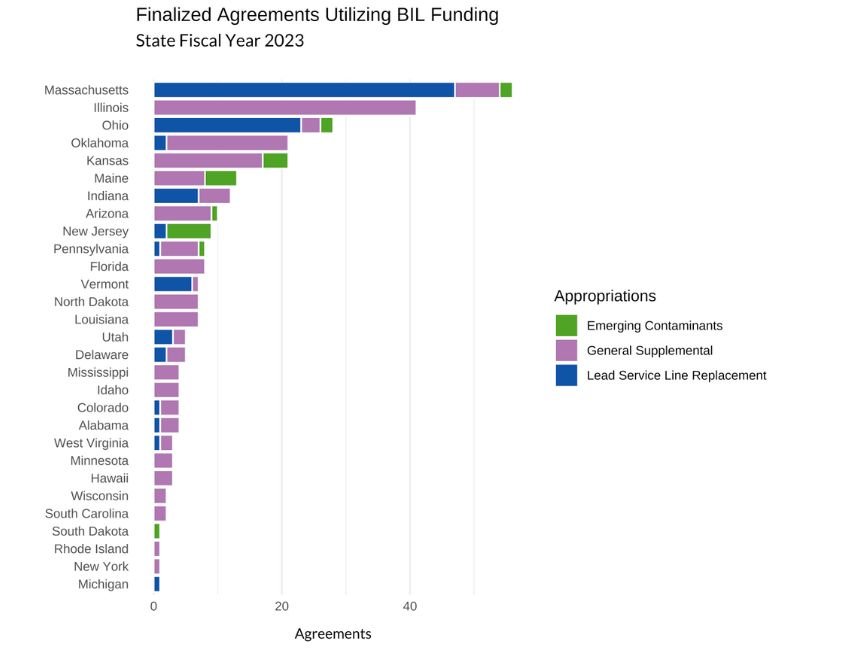
Massachusetts leads the way with 56 agreements, the majority of which support lead service line replacement. Illinois follows with 41 projects, most of which utilize General Supplemental funds. Ohio rounds out the top three with 28 mostly lead-related projects. The next five states all have between 10 and 21 projects, while the remaining 21 states listed less than 10 projects.

Exploring the awarded funds, Ohio has utilized over $211 million, or approximately 20% of the supplemental funds in this data release. Colorado, despite only submitting four final agreements, accounts for another $130 million. Though submitting the most finalized agreements, Massachusetts is allocating $59 million, electing to fund many comparatively smaller projects where others prioritize fewer, but larger projects.
Most noteworthy is the remaining 21 states that did not submit a final agreement including any Bipartisan Infrastructure Law funds. Further, of the states that did finalize agreements, they utilized only a small fraction of the allocated totals.
Lead Service Line Replacement

With this first data release, only 13 states submitted finalized agreements taking advantage of the BIL LSLR funds. Massachusetts led the way with 47 finalized agreements, while Ohio reported 23. The remaining states finalized seven or less, with five funding only a single agreement.

Comparing the total assistance awarded, however, these projects varied greatly in project cost and total need. For instance, although Colorado only finalized one agreement, it was a massive undertaking of more than $76 million to replace toxic lead service lines throughout Denver. This agreement stands in contrast to the numerous, smaller agreements Massachusetts signed, where the total assistance is just over $11 million.
These disparities in both the quantity and magnitude of projects highlight the unique challenges states face in addressing lead service line replacement and their differing strategies in achieving their goals.
Estimated Lead Service Lines Replaced
Included within the EPA Portal data is an optional field for “Estimated Lead Service Lines Replaced.” With the six states that completed this field, we get a sense of the replacement rate and cost per service line for these agreements.

The variance in pipes replaced and cost per service line is substantial. New Jersey estimates replacing more than 16,000 lead lines with $14m, using an average of $885 in BIL LSLR funds per pipe replaced. On the other end of the spectrum, Colorado’s single project estimates replacing 2,700 lead lines. The $76m agreement amount averages to $28,000 per line. The remaining states are scattered between these two extremes.
This disparate range of estimates suggests that we may simply not have enough data to know the true replacement costs, though estimates currently suggest the average is somewhere between $4,700 and $10,000. Costs likely vary greatly across regions and even individual projects. States may also be using additional funding sources outside of the SRF and BIL funds, driving down the costs presented here.
Even so, this first preview further highlights the challenges states face in allocating funds to replace lines across systems with the historic funding available for a limited time.
Emerging Contaminants
With only 23 finalized agreements utilizing BIL Emerging Contaminant funds, there are limits to how much can be said about what we know so far.

New Jersey finalized nearly one-third of all emerging contaminants agreements, with Maine and Kansas submitting another five and four respectively. While concerning, it is not particularly surprising to see so few states fund projects related to emerging contaminants. They are, by definition, emergent problems that states and borrowers are still strategizing how to address. And the issue of limited capacity once again crops up - while many states were already ramping up efforts to tackle replacing toxic lead lines, the same expansion of effort is still building across the country for these specific concerns.

Similar to lead projects, the distribution of projects funded doesn’t consistently correlate to the assistance provided. Here, Ohio leads with $46m in total assistance, despite only finalizing two agreements. Unlike the lead service replacement funds where Massachusetts funded a variety of smaller projects, here the state is funding only two projects, but still utilized the third-most funds.
Where Do We Go From Here?
This first indication of how states are taking advantage of the historic Bipartisan Infrastructure Law supplemental funds presents more questions than answers.
How will states expand capacity to get funds out the door as project applications and allocations stack up? How do these trends impact the ambitious, necessary goal of replacing all lead service lines in ten years? How can the EPA expand support for states and borrowers to capitalize on this once-in-a-lifetime opportunity?
These finalized agreements represent over $1 billion of federal funds flowing into communities, but with more than $5 billion allocated in 2022 alone, states have only scratched the surface of opportunity ahead.
That said, these small steps represent real progress to improve access to safe drinking water, develop more robust water systems, and enable communities to replace lead service lines.
And the good news is they are just getting started.